Kentucky Oaks Trends 2018
In the last article, Kentucky Derby Trends 2018, a reader commented:
“Great article Neal! Wonder how this translates to the Oaks race?”
That’s a good question I thought. In this article I will try to answer that question. Although the fillies run only 9 furlongs in the Oaks, compared to the colts going 10 furlongs in the Derby, the question of the stretch run in Prep races remains the same since horses are coming from racetracks that have a stretch run much shorter than Churchill Downs. The results suggest stretch length might be a bigger factor in the Oaks than in the Derby. Keep reading …
The diagrams below shows the stretch runs for Gulfstream Park and Santa Anita Park. The length of the stretch runs are shown in feet beneath the blue arrows.
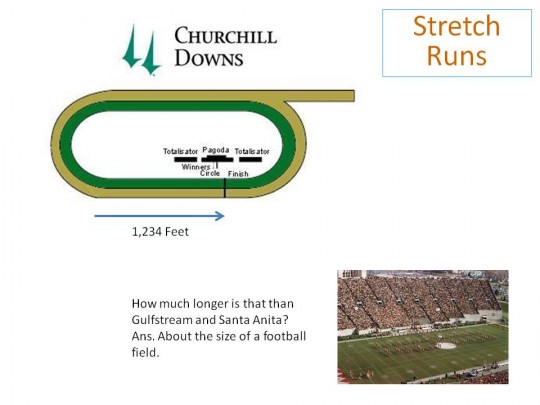
Let’s compare that to the stretch run at Churchill Downs.
I often hear people talking about the “speed favoring” surfaces of Santa Anita and Gulfstream Park. I think these diagrams point out nicely that it might be more than just the surface. Unlike Gulfstream and Santa Anita, at Churchill Downs, after horses make that final turn for home, they have much more ground (and opportunity) to catch the pacesetters in the race.
In case you’re wondering how Churchill Downs compares to some other major racetracks in stretch runs, click here to read an article that has a chart of most major tracks in the United States and their stretch run size.
Considering the variations in stretch runs discussed previously, I went back ten years and charted the 1-2-3 finishers in each Kentucky Oaks … showing the racetrack where they had run their previous race. I found some surprising results. Below is a chart – showing year by year the race track where the top three finishers in the Oaks had their prior race.
| Kentucky Oaks Finishers Prior Race | |||
|---|---|---|---|
| Year | Win | Place | Show |
| 2017 | Santa Anita | Keeneland | Aqueduct |
| 2016 | Keeneland | Fairgrounds | Aqueduct |
| 2015 | Keeneland | Fairgrounds | Fairgrounds |
| 2014 | Fairgrounds | Aqueduct | Fairgrounds |
| 2013 | Aqueduct | Santa Anita | Fairgrounds |
| 2012 | Fairgrounds | Aqueduct | Gulfstream |
| 2011 | Sunland | Fairgrounds | Santa Anita |
| 2010 | Oaklawn | Keeneland | Oaklawn |
| 2009 | Oaklawn | Turfway Park | Fairgrounds |
| 2008 | Keeneland | Keeneland | Oaklawn |
The racetrack that has sent the most number of In-The-Money finishers to the Kentucky Oaks in the last ten years is Fairgrounds. Below is a summary of the above chart that points this out much clearer. For reference, relating back to what was discussed at the top of the article are the stretch runs for each of these racetracks.
| Prep Racetrack | Oaks ITM Finishers | Stretch Run (in feet) |
|---|---|---|
| Fairgrounds | 9 | 1346 |
| Keeneland | 6 | 1174 |
| Aqueduct | 5 | 1320 |
| Oaklawn | 4 | 1155 |
| Santa Anita | 3 | 990 |
| Gulfstream | 1 | 898 |
| Turfway | 1 | 970 |
| Sunland | 1 | 990 |
The above chart shows a clear trend that seems to favor horses coming out of Prep races from tracks with a stretch run similar to Churchill Downs (1,234 feet).
Fairgrounds is the clear leader with this angle. Also of interest, the nine ITM finishers from Fairgrounds had an average of 10-1 odds at post time, ranging from even money (Rachel Alexandra) to a high of 26-1, with all but Rachel being at least 5-1.
Contrary to the Derby results, fillies coming out of Aqueduct Prep races have done much better in the Oaks, hitting the board in five of the past six years. By comparison, the colts coming from Aqueduct are 0 for 31 in Derby results. Click here to see full article on Derby trends.
Fillies coming from Santa Anita and Gulfstream Park have not done nearly as well as the colts have managed in the Derby, where they have won eight of the last fourteen Derbies. In ten years, the fillies coming from SA and GP have managed only a single win, one place, and two show results in the Kentucky Oaks.


3 comments on “Kentucky Oaks Trends 2018”