Kentucky Derby Trends 2018
This article includes some trends about recent Kentucky Derby winners and other horses that have finished in the money for the Derby. Part of this discussion has to include the special challenge of distance for Derby contestants and related to that, the added challenge of horses facing a stretch run that is quite long at Churchill Downs.
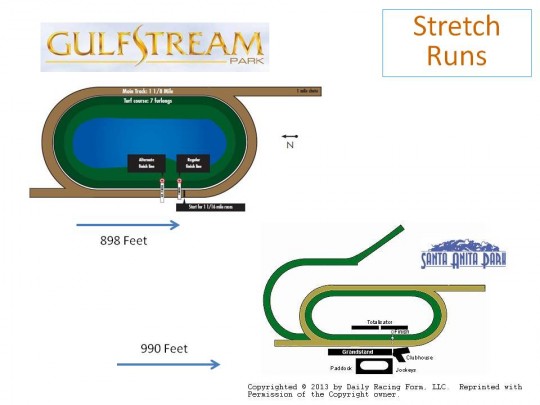
As most people are aware, the Kentucky Derby is 1 1/4 mile (10 furlongs) long. A distance that no horse in the field has ever run prior to the Derby. That alone is challenge enough. In addition to that, many of the horses are coming from racetracks that have a stretch run considerably shorter than at Churchill Downs. The diagrams below shows the stretch runs for Gulfstream Park and Santa Anita Park. The length of the stretch runs are shown in feet beneath the blue arrows.
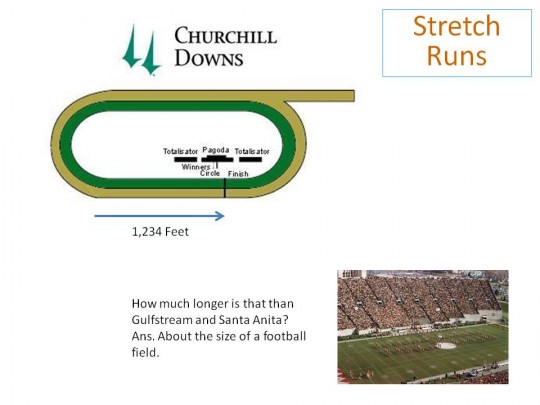
Let’s compare that to the stretch run at Churchill Downs.
I often hear people talking about the “speed favoring” surfaces of Santa Anita and Gulfstream Park. I think these diagrams point out nicely that it might be more than just the surface. Unlike Gulfstream and Santa Anita, at Churchill Downs, after horses make that final turn for home, they have much more ground (and opportunity) to catch the pacesetters in the race. That might explain why in the past 32 years, only three times has a “Wire” type horse won the Kentucky Derby on a fast track.
In case you’re wondering how Churchill Downs compares to some other major racetracks in stretch runs, click here to read an article that has a chart of most major tracks in the United States and their stretch run size.
So how many favorites have won the Kentucky Derby? Surprisingly, in recent years, eight of the last fourteen favorites have won the Kentucky Derby, including the last five in a row. A 57% win rate for favorites is a bit surprising, especially given the size of the Derby fields. And, if you go back further, prior to Fusaichi Pegasus’ win in the year 2000, from 1980 to 1999 (twenty years) there were exactly ZERO favorites that won the Derby.
Here’s a look at the average payouts in recent years. Going back 25 years, we found the average Win Price to be around $28. The last five years however have been well below that average ($11.40, $6.60, $7.80, $7.00, and $12.80).
What was a little more surprising was the average payout for the Exacta was around $800. And, although the gigantic exacta payout of $9,800 in 2005 (Giacomo and Closing Argument) skews that a bit, consider that despite favorites winning in the past five years, three (Orb, California Chrome, and Always Dreaming) were involved in exactas that paid $981, $340, and $336 respectively.
Trifecta payouts have averaged around $11,500 in the past 25 years, and 8 of the last 10 Derby trifectas have paid more than $2,300. And once again, despite favorites winning in the past five years, three (Orb, California Chrome, and Always Dreaming) were involved in trifectas that paid $6925, $3424, and $16,594 respectively.
I started thinking about the high payouts for Win, Exacta, and Trifecta wagers on the Derby (all bets dependent on knowing the horses that finish In-The-Money). Considering the variations in stretch runs discussed previously, I decided to go back several years and chart the 1-2-3 finishers in each Kentucky Derby … showing the racetrack where they had run their previous race. I found some surprising results. Below is a chart – showing year by year the race track where the top three finishers in the Derby had their prior race.
| Kentucky Derby Finishers Prior Race | |||
|---|---|---|---|
| Year | Win | Place | Show |
| 2017 | Gulfstream | Oaklawn | Santa Anita |
| 2016 | Gulfstream | Santa Anita | Fairgrounds |
| 2015 | Oaklawn | Sunland | Santa Anita |
| 2014 | Santa Anita | Fairgrounds | Oaklawn |
| 2013 | Gulfstream | Fairgrounds | Fairgrounds |
| 2012 | Santa Anita | Oaklawn | Keeneland |
| 2011 | Turfway | Oaklawn | Fairgrounds |
| 2010 | Oaklawn | Gulfstream | Keeneland |
| 2009 | Sunland | Santa Anita | Hawthorne |
| 2008 | Gulfstream | Oaklawn | Hawthorne |
| 2007 | Keeneland | Turfway | Oaklawn |
| 2006 | Gulfstream | Keeneland | Oaklawn |
| 2005 | Santa Anita | Keeneland | Oaklawn |
| 2004 | Oaklawn | Keeneland | Santa Anita |
Just glancing down this list, it might not jump out at you, but the racetrack that has sent the most number of In-The-Money finishers to the Kentucky Derby in the last fourteen years is Oaklawn Park. Below is a summary of the above chart that points this out much clearer. For reference, relating back to what was discussed at the top of the article are the stretch runs for each of these racetracks.
| Prep Racetrack | Derby ITM Finishers | Stretch Run (in feet) |
|---|---|---|
| Oaklawn | 11 | 1155 |
| Santa Anita | 8 | 990 |
| Keeneland | 6 | 1174 |
| Gulfstream | 6 | 898 |
| Fairgrounds | 5 | 1346 |
| Turfway | 2 | 970 |
| Hawthorne | 2 | 1320 |
| Sunland | 2 | 990 |
What I find most interesting from this summary is the racetrack (Oaklawn 1,155 feet) that has sent the most In-The-Money finishers to the Kentucky Derby has a stretch run very similar in length to that of Churchill Downs (1,234 feet).
The next logical question is how many starters were in the Kentucky Derby with prior races from the above tracks, and what was the percentage of times they hit the board? Below is the chart, sorted by Percentage ITM. I included only tracks with at least twenty starters in the Derby in the past fourteen years.
| Prep Racetrack | Derby ITM Finishers | Starters | Percentage ITM |
|---|---|---|---|
| Fairgrounds | 5 | 20 | 25% |
| Oaklawn | 11 | 45 | 24% |
| Santa Anita | 8 | 34 | 24% |
| Gulfstream | 6 | 36 | 17% |
| Keeneland | 6 | 64 | 9% |
| Aqueduct | 0 | 31 | 0% |
A few things stand out on this chart:
- Once again Oaklawn Park is near the top of the list, this time in terms of percentage of ITM finishes at the Kentucky Derby.
- Fairgrounds, another track with a stretch run very similar to Churchill Downs, had only twenty horses make their next start in the Derby, yet five of them hit the board for a 25% rate.
- The low percentage of ITM finishes from horses who ran their prior races at Keeneland, only 9%.
- Horses coming out of Aqueduct prep races are 0 for 31 hitting the board in the Kentucky Derby!
You can’t argue that eight of the last fourteen Derby winners had their prior race at Gulfstream or Santa Anita Park. But, with that said, only six other GP or SA horses finished in the top three. So, if you’re looking for horses to include in your exacta, trifecta, or superfecta wagers … I’d give a look to horses coming from racetracks like Oaklawn and Fairgrounds.


8 comments on “Kentucky Derby Trends 2018”