Understanding Beyer Speed Figures
Beyer Speed Figures appear in the Daily Racing Form for races run in North America. These Figures represent a relative measure of how fast a horse finished in a prior race. The higher the number the faster the horse ran. The calculation of these figures is based on a formula created by Andrew Beyer and incorporated into the DRF starting in 1992. These Figures continue to be calculated by a group of individuals working on behalf of Andy Beyer.
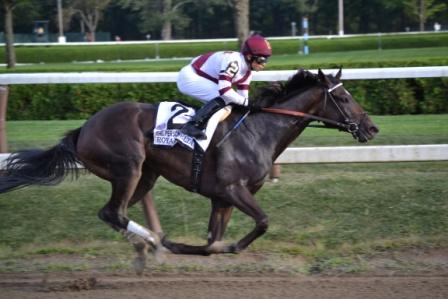
Royal Delta (Earning a 105 Beyer Figure at Saratoga)
The intent of Speed Figures (Beyer or other) is to provide a quantitative measure of how fast a horse ran in a race, and provide the handicapper a measure that is consistent across a multitude of race tracks, distances, and surfaces. As we have discussed in prior articles, there is considerable variance between the surfaces of different tracks. What we didn’t discuss is the variability that can occur at a single track from day-to-day, and on occasion from race-to-race. This is generally referred to as a track variant. This variant is applied to the raw finishing time of each race, and ultimately affects the final Speed Figure assigned to each horse.
We’re not going to get into all of the details on the calculation of these Figures, nor the debate on their effectiveness when compared to other Figures (e.g. TimeformUS, Brisnet, Ragozin, etc.) at this time. For now, suffice it to say they reasonably reflect the final time of each race run by a horse, and do provide a measure of comparison between different tracks, distances, and surfaces.
So, let’s provide some examples. Below is an extract from the Past Performances of a couple horses that ran at the same distance (8.5 furlongs) at four different race tracks. We’ll discuss the final times, the resulting Beyer Speed Figures, and why at first glance these figures seem contradictory.
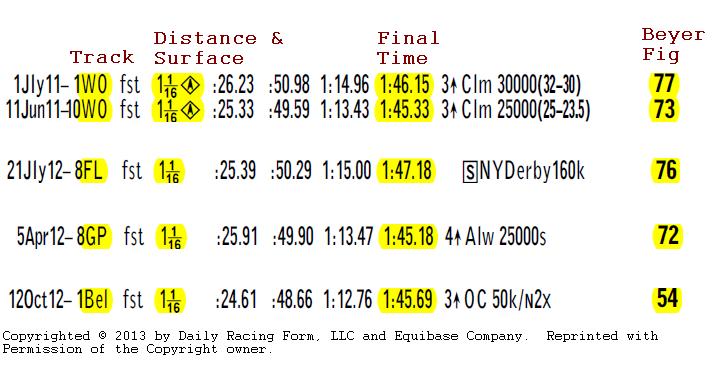
Let’s start with the first two races listed at Woodbine (WO) race track on June 11 and July 1, 2011. Notice the final time for the race rune on June 11 (1:45.33) is faster than the time for the race on July 1 (1:46.15). However, the Beyer Figure is actually higher for the July 1 race. How can that be? Well, for that day of racing (July 1) the collective times for the races run were likely slower (when compared to Par Figures) than the collective times for the races run on June 11. That’s the track variant factor that I mentioned above. This variant is calculated and applied independently for every race track on every day of racing.
Next let’s contrast the final times between Woodbine and the third race listed in the example above, a race run at Finger Lakes (FL) race track on July 21, 2012. Despite being a full second (1:47.18 vs. 1:46.15) slower than the July 1 race at Woodbine, the Beyer Figures are almost identical 76 and 77. Why?
In this case we’re comparing two different race tracks and two completely different surfaces. The Woodbine races were on a Synthetic surface, and the Finger Lakes race was run on a Dirt surface. When computing the Beyer Speed figures, they concern themselves only with the comparable (Par) times at that specific race track and the variant for that day (at that track).
Next let’s compare Finger Lakes to a Gulfstream Park (GP) race run on April 5, 2012. Notice the final time for the GP race is a full 2 seconds faster than the FL race, yet has a lesser Beyer Speed Figure (72 compared to 76). How can that be? Here we are comparing two dirt tracks, but they have vastly different surfaces. The Finger Lakes surface is traditionally much deeper and slower, while the Gulfstream Park surface is quicker. Think of the difference between running at the beach on the compacted sand near the water, as opposed to the sand 20 feet from the water’s edge. It’s probably not that dramatic, but you get the point.
The last comparison we’ll make is between Gulfstream Park and the Belmont (Bel) race on October 12, 2012. The times are fairly similar, yet the Belmont race has a Beyer Fig 18 points lower. When contrasting these two tracks (which are both dirt) there is more than meets the eye at the 8.5f (1 1/16 miles) distance. The diagram below will help to explain.
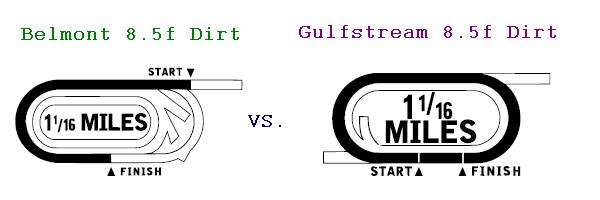
Even if these two tracks had the identical surface, the configurations of the track are completely different. Belmont at 8.5f is a 1-Turn race, while Gulfstream at the same distance is a 2-Turn race. That means the horses have to navigate two turns, and obviously that affects the final time. The Beyer Speed Figures represent the final times within the context of the specific track in which the race was ran. This allows you to compare figures between different tracks and have confidence that the variables have been factored into the process.
I’ve thrown a lot at you here, and it might seem a little fuzzy at this point. If this game were easy, there would be a lot of rich horseplayers out there. For now, let’s just say; when comparing different horses and races in the past performances, the higher the Beyer Speed Figure the better. In later articles, we’ll dig into the topic much more, discussing how to utilize these figures in your handicapping process.
11 comments on “Understanding Beyer Speed Figures”