Know Your Trainers – Bob Baffert vs. Jerry Hollendorfer
A frequent question asked by new fans trying to learn more about horse racing is, “Where do I begin?” My immediate response is generally, “Get to know your trainers.” While learning about topics like distance, class, and pace are important … in my opinion, none are as important as learning about the tendencies, strengths, and weaknesses of trainers. With that thought in mind, we continue our series of articles called “Know Your Trainers.”
In this series we will dig into the statistics of some head trainers and try to make sense of the numbers we find. We thought it might be fun to present the numbers in a “competitive” manner by pairing trainers. With that said, we are not trying to judge the trainers or claim that one is better than another. Our intention is to pair trainers who have statistics in comparable categories and present some plausible reasons why they might differ.
So let’s continue with two of the big names in California, Bob Baffert and Jerry Hollendorfer. Our focus will be in these areas; Graded Stakes, First-Time-Starters, Del Mar, and a couple of profitable angles we uncovered along the way.
Before we start, here is an explanation of each column in the charts below:
- STR = Number of starts
- 1st = Number of wins.
- 2nd = Number of place finishes.
- 3rd = Number of show finishes.
- WIN% = Overall percentage of wins based on number of starts.
- ITM% = Percentage of times the horse finished In-The-Money (1st, 2nd, or 3rd).
- ROI = Return on Investment, based on a $2 flat Win bet for every starter. Over $2 is profitable. For example, if there were 100 starters, and the ROI was $3 … The total wagered would equal $200 ($2 x 100). The return would be $300 ($3 x 100). If the ROI were $0.50, then the return would be $50 (50-cents x 100) … resulting in a loss of $150.
We’ll kick this off with a look at their records in Graded Stakes races for races contested on dirt surfaces. The chart below shows their record for Route Races (1-mile and over) by Grade type (e.g. 1, 2, 3). Due to the number of starters, we limited Bob Baffert’s statistics to just the past two years. Hollendorfer’s results are for the past five years.
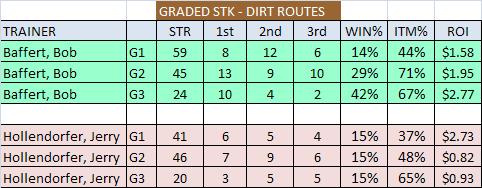
Very interesting to see that Bob Baffert starts a lot more horses in Grade-1 races, but his best results are in Grade-3 races, where he wins at a 42% clip, and has a solid ROI of $2.77. In fact, you can see the clear progression of both wins and ROI reading down the chart from Grade-1 to Grade-3. Baffert’s In-The-Money percentages are also considerably better for Grade-2 and Grade-3 races.
Hollendorfer has a moderate, albeit consistent, win rate in all levels of these Graded Stakes, at 15%. His ROI in Grade-2 and Grade-3 races is quite low, with both being less than $1. And even his ROI ($2.73) in Grade-1 races is skewed a bit by the influence of a 37-1 winner (Dakota Phone) in the 2010 Breeders’ Cup Dirt Mile. Bottom line for Hollendorfer, his overall results in Graded Stakes races going long on the dirt are a risky proposition for the horseplayer, with not much reward for the win ticket that gets cashed only 15% of the time.
The chart below shows their record for Sprint Races (under 1-mile) by Grade type (e.g. 1, 2, 3). The statistics for both trainers include the last five years.
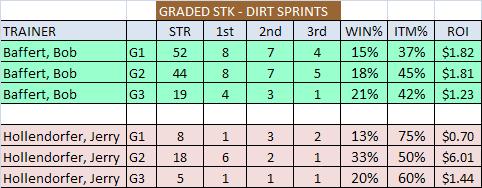
You can see that Baffert has a similar progression in the Win% column by Grade Type. However, his ROI falls to a dismal $1.23 in the Grade-3 category. Hollendorfer has substantially less starters at all levels, but his results in Grade-2 races does stand out, with a Win rate of 33% and an ROI of $6.01.
Next we’ll look at their records in Graded Stakes races for races contested on turf courses. We’re only going to look at route races on turf, as both trainers have minimal turf sprints in their portfolio.
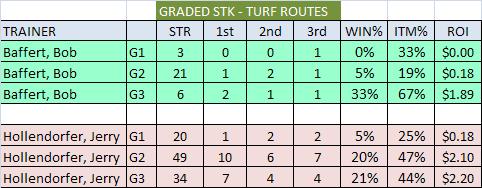
This category displays a sizable difference in the two stables. First, you can see that Bob Baffert has very few Graded Stakes caliber horses that are meant for the turf. In five years, he’s had a grand total of THREE winners. Contrast that to 93 Graded Stakes winners on the dirt. His record of 1 for 24 in G1 and G2 races makes him almost a throwout in these events.,
While Hollendorfer has struggled in Grade-1 races over the turf, his results in G2 and G3 races is solid with a 20% win percentage. His ROI is also in the positive territory here, being over $2 at both levels. Clearly, Jerry Hollendorfer has more “turf-meant” horses in his stable than Bob Baffert.
Now we’ll switch gears a bit, and check how our two feature trainers do with first-time starters. The chart below includes the past two years, and is limited to sprints, which is the vast majority of their FTS. Also, we decided to divide the results by age group: separating 2-year olds from horses that are 3-years old and up.
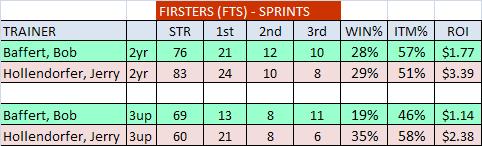
Looking at just the 2-year old results is quite interesting. While Baffert and Hollendorfer are almost dead even in terms of Win%, their ROI is dramatically different. This tells us that Mr. Baffert is being severely over-bet in these events. Winning at a superb rate of 28%, yet having an ROI of only $1.77 says it all. Hollendorfer’s Win rate of 29% says that his 2-year old horses are also ready to run at first asking … and the ROI of $3.39 means that backers are rewarded accordingly when they do win.
The category of older horses (3up) shapes up slightly different than the juveniles. Hollendorfer trained firsters win at an exceptional rate of 35% and Baffert firsters only 19%. His ROI of $2.38 suggests that less of them are slipping by the horseplayers than the 2-year olds, but nonetheless still positive. Baffert’s ROI of $1.14 tells the same story as above, his horses are being over-bet regardless of their age. And, since he’s winning 9% less at this age group, his backers are really taking it on the chin.
This emerging trend of Baffert horses being over-bet, caused us to review some “Big Picture” categories for Bob Baffert in order to contrast his winning percentages to ROI. Below is what we found for the past two years.
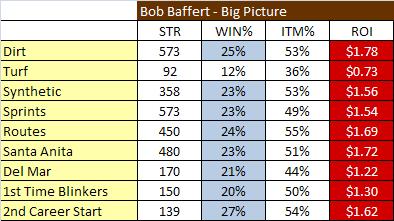
We’ve already established that Baffert is clearly not loaded with turf horses, so the turf win rate of 12% is no surprise. But the rest of the categories, from surface to distance to race track to equipment changes, etc. show a very solid win rate of 20%-27% and in-the-money rate of 44%-55%. Yet … his ROI numbers are between $1.30 and $1.78 for these corresponding categories. This definitively shows that the betting public is pushing “all in” whenever Bob Baffert starts a horse in a race.
This realization left us wondering, aside from the category above (Grade-3 Dirt Routes), are there any angles that will turn a profit on a Baffert trained horses? We found a couple to share.
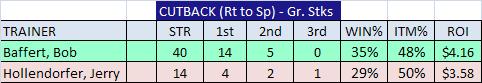
The chart above shows the results of a popular handicapping angle we’ve explained in the past. Click here to read an article on cutbacks. What we found inside the numbers was nothing special about cutbacks for our two trainers if you look at their overall statistics. However, if you restrict the cutbacks to include only Graded Stakes races, the results are profitable. In fact, if you combine the two trainers, in 25 out of 54 races (46%), they finished either 1st or 2nd. By any measure this is a solid angle to remember for both of our trainers.
The next profitable angle we found for Mr. Baffert, did not hold up for Jerry Hollendorfer. It involves the first time he drops a horse in for a claiming tag. Below are the numbers.
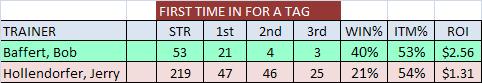
Bob Baffert wins at a very high rate of 40% in this situation. The fact that his ROI is only $2.56 suggests he’s still being over-bet in these races, but at least a horseplayer can count on a high percentage of wins for the purpose of multi-race bets. Hollendorfer has a respectable win rate of 21%, but his ROI of only $1.31 says that his backers are paying the price in low returns when he does win. Note, the above numbers exclude moves from Maiden Special Weight to Maiden Claiming races. Below is the chart showing these results.
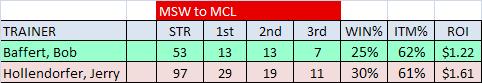
You can see that our two trainers have very similar results, and that despite solid win percentages, their ROI rates are in the losing end of the spectrum. This seems to be a pattern oft repeated.
With the Del Mar meet in full swing at the time of this writing, we decided to close with the results of our two trainers over the synthetic surface, which is scheduled to be replaced with dirt in 2015. We separated their results into categories of sprint and route.
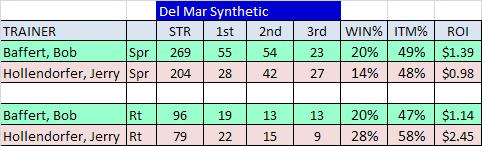
For Bob Baffert, we see the exact same situation repeated in both Sprints and Routes – a decent winning percentage (20%), but very low ROI.
Hollendorfer, on the other hand, shows a stark contrast between his results in Sprints vs. Routes. His Win rate (28%) in routes is exactly double his percentage in sprints. Also, his ROI is a profitable $2.45 for routes.
Summary
The information above suggests that you really have to pick your spots when placing Win wagers on these two California trainers. They will win their fair share of races, but will the reward always match the risk? There are exceptions, and they differ for each trainer.
When constructing multi-race wagers, it’s probably hard to leave their horses off the ticket, due to their high win percentages. But, in the Win pool, it seems that the best opportunity for value lies in selecting horses that are trained by someone not named Baffert or Hollendorfer.
————————————————————
Below are some prior “Know Your Trainer” articles. Click on their names to read the article.
Christophe Clement vs. Graham Motion

This article sponsored by.
2 comments on “Know Your Trainers – Bob Baffert vs. Jerry Hollendorfer”