Know Your Trainers – Tom Morley vs. Ben Colebrook
A frequent question asked by new fans trying to learn more about horse racing is, “Where do I begin?” My immediate response is generally, “Get to know your trainers.” While learning about topics like distance, class, and pace are important … in my opinion, none are as important as learning about the tendencies, strengths, and weaknesses of trainers. With that thought in mind, we continue our series of articles called “Know Your Trainers.”
In this series we will dig into the statistics of some head trainers and try to make sense of the numbers we find. We thought it might be fun to present the numbers in a “competitive” manner by pairing trainers. With that said, we are not trying to judge the trainers or claim that one is better than another. Our intention is to pair trainers who have statistics in comparable categories and present some plausible reasons why they might differ.
In our recent reader survey we received several requests to see trainer comparisons on young trainers. We decided to pick two that we know well and have interviewed in the past. The two trainers are on different racing circuits. Tom Morley trains in New York, while Ben Colebrook prepares his charges in Kentucky.
Before we start, here is an explanation of each column in the charts below:
- STR = Number of starts
- 1st = Number of wins.
- 2nd = Number of place finishes.
- 3rd = Number of show finishes.
- WIN% = Overall percentage of wins based on number of starts.
- EXA%= Percentage of times the horse finished in an exacta position (either 1st or 2nd).
- ITM% = Percentage of times the horse finished In-The-Money (1st, 2nd, or 3rd).
- ROI = Return on Investment, based on a $2 flat Win bet for every starter. Over $2 is profitable. For example, if there were 100 starters, and the ROI was $3 … The total wagered would equal $200 ($2 x 100). The return would be $300 ($3 x 100). If the ROI were $0.50, then the return would be $50 (50-cents x 100) … resulting in a loss of $150.
At the time we gathered the statistics for this article, Tom’s horses had started 170 races and Ben’s horses had started 177 races. Being young trainers, we took a much different approach from prior “Know Your Trainer” articles in determining what categories to review. We decided to begin by having a look at the top three jockeys each trainer has used thus far.
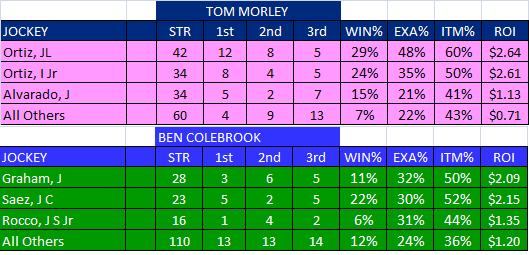
It’s plain to see that Tom Morley has leaned heavily on the Ortiz brothers, Irad Jr. and Jose. And, the results suggest they have rewarded him in kind. Both jockeys sport solid win, exacta, and ITM percentages … in addition to a very positive ROI to reward their backers. It’s interesting to see the precipitous decline in Win% and ROI when Tom employs riders other than his top three.
Ben Colebrook’s statistics paint a somewhat different story. His top three jockeys saw much less action than Tom’s top three guys. Included in the “All Others” category for Ben are 39 different jockeys, and collectively their overall Win% is actually better than two of the three named jockeys (Graham and Rocco).
The following chart shows the results of our two trainers categorized by the closing odds of their horses.
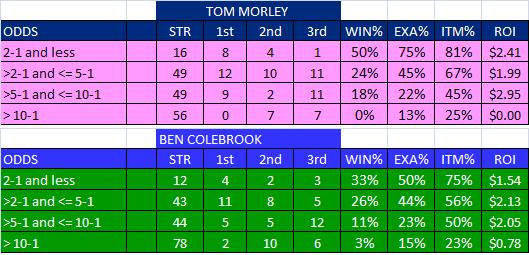
Tom sports a solid 50% Win and 75% Exacta rate with well bet (2-1 or less) horses. As you might expect, his Win% is less in the next two categories, but still strong at 24% and 18%. His ROI is strong in every category except for the last. It’s a fair conclusion that when Tom’s horses are backed at the windows, they respond accordingly. The same can be said for Ben, as he has a solid Win% at odds of 5-1 or less, and a positive ROI through odds of 10-1.
Where a horseplayer has to pause is when our two trainers have horses in the 10-1 or higher range. Combined they are 2 for 134 in the Win column. Based on this information, it might be best for a horseplayer to limit action on our trainer’s longshots to the lower rungs of their wagers.
Bottom line – these statistics would be respectable even for a trainer with several years of experience. The fact that Tom and Ben have been training for a short time make these numbers all the more impressive.
Next we’re going to isolate each trainer’s results on combinations of surface (dirt, turf, synthetic) and distance (sprint, route). You will notice that Tom does not have any results for Synthetic surfaces, because there aren’t any on the NY circuit. Ben has Synthetic results, but these numbers will decrease in the future with the changeover of Keeneland from synthetic to dirt.
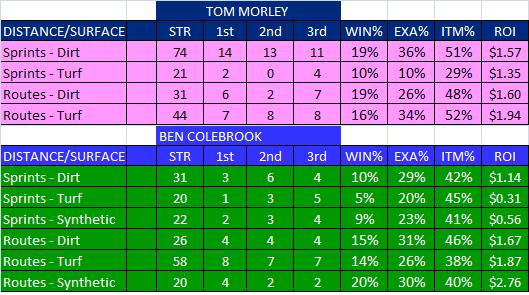
The majority of Tom’s starters have been sprinting on the dirt, while Ben has had the largest number of starters on the turf going long. Overall, Tom has won 19% on the dirt in both sprints and routes, and his turf routers are a respectable 16% winners. Ben shows a clear difference between sprints and routes, winning between 5% – 10% in sprints, but that increases to 14% – 20% in routes. Maybe the focus of Ben’s horses in sprint races has been to prepare them to stretch out later.
Both of our trainers have struggled getting Turf Sprinters into the winner’s circle. If you combine them, they have won 3 of 41 and finished in the exacta only 6 of 41 times. Horseplayers might want to limit their Turf Sprinters to the lowest rungs of exotics.
With young trainers, it’s always good for horseplayers to get a handle on how “well meant” their new runners are in their debut race, as well as their 2nd start. The following chart shows our trainer’s results by their first and second start of a horse. We separated the results by age group (2-year old vs. 3yr and up).
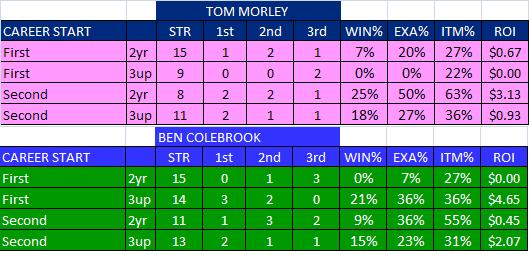
Tom’s results for first-time-starters (FTS) makes it very clear that he is taking a conservative approach when bringing his horses to the track for the first time, whether they are 2-year old horses or older. However, they have shown considerable improvement in their second start, winning 4 of 19 times, and finishing ITM 9 of 19 times.
Ben’s results for 2-year old horses is very similar to Tom. In fact, if you combine the two trainers, their 2-year old FTS are 1 for 30. However, Ben has done quite well with older horses (3up) making their debut, with 5 of 14 finishing first or second. Overall, Ben’s numbers suggest that he is bringing his 2-year old horses along slower than the older horses. A tactic that might work well for him in the long run. In fact, on November 15, Ben won his first Grade-2 Stakes race with a filly named Sparkling Review, who did not even start as a 2-year old. She finished off the board in her 3-year old career debut, but since has rattled off four consecutive victories, earning over $300,000. Patience is a virtue.
Overall the future seems bright for these two young trainers. Both have shown the ability to win races for their owners. Both seem patient with their young horses. Both have won races and placed in-the-money when their horses were backed by the bettors. And additionally, something you don’t see in the statistics – both men are hungry for success, received superb training from their masters, and possess an even temperament that will serve them well in a business that has infinite ups and downs.
Click here to learn more about Tom Morley in an interview with him.
Click here to learn more about Ben Colebrook in an interview with him.
One comment on “Know Your Trainers – Tom Morley vs. Ben Colebrook”