TimeformUS Speed Figures – Explained and Contrasted to Beyer Figs
In a prior article we introduced TimeformUS as “The new racing form in town!” Click here to read our overview of TimeformUS and our list of top ten features. Included in the list of features we provided was “Speed figures that incorporate pace into the calculation.” In this article we will explain TimeformUs speed figures and provide an example of a specific race at Saratoga to illustrate how they differ from Beyer Speed Figures.
The race we will be using in our article is the Grade 2, Bernard Baruch Handicap run at Saratoga on August 30,2014. The race was run at a distance of 11/16 mile (8.5 furlongs) over a firm turf course. We are going to focus on the resulting TimeformUS speed figures for three horses in this race. The horses are Sayaad (#9), Optimizer (#2), and Wise Dan (#4).
In order to better understand our explanation of the speed figures, it will be quite helpful to watch the video replay of the race and take note of the race call provided by Tom Durkin and the position of our three horses during the running of the race. Below is the video race replay.
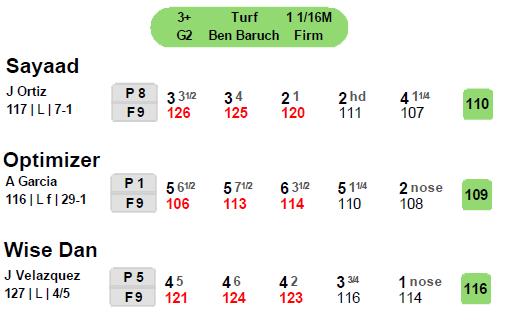
During the call of the race, Tom Durkin said “The half up in a strong 461/5.” At that moment, of our three horses, Sayaad (#9) was closest to the pace, Wise Dan (#4) was about a length behind him, and Optimizer (#2) roughly another 11/2 lengths behind him. Their position will be important to understanding the resulting TimeformUS speed figures. Below is an excerpt of the TimeformUS past performances for each horse in this race.
The default TimeformUS speed figures earned by each horse are in the far right column in the green box. We say “default” because, as we will explain later, they can be adjusted. To further explain the TimeformUS information (reading from left to right), beneath the jockey’s name is the weight carried, medication (L=Lasix), final odds, post position, field size, running lines (with Pace figures underneath), and final speed figure.
Without any explanation of how these figures are computed, a couple of questions might immediately come to mind.
- If Sayaad finished 4th and Optimizer finished 2nd, how did he end up with a higher speed figure [110] vs. [109]?
- If only a nose separated Wise Dan and Optimizer at the finish, how come the figure for Wise Dan was seven points higher [116] vs. [109]?
The answer to the first question can be fully explained by the fact that TimeformUS incorporates the pace of the race into the calculation of their speed figures. As you saw in the video replay, Sayaad chased a fast pace (remember the “strong 461/5” comment made by Tom Durkin), while Optimizer sat further back in the pack. Even if you didn’t watch the video, the higher pace numbers shown in the running lines {126,125,120} for Sayaad versus {106,113,114} for Optimizer reflect that fact. TimeformUS adjusts the final speed figure for each horse based on the difficulty of the pace.
That does not mean a horse will automatically receive a boost in his final speed figure just because he is closer to the pace. It all depends on whether the pace was slow or fast. For example, let’s say the pace was very slow … maybe 491/5 for the half mile instead of 461/5. In that case, a horse who manages to gain ground on the leaders in the lane would receive a boost in his speed figure, since he most likely had to close into a fast finishing time from the horses on the lead, and thereby overcame a slow pace.
Now, to answer the second question above; With only a nose between them, why is the speed figure for Wise Dan [116] seven points higher than Optimizer [109]? At first glance, you might think it’s the same scenario involving the pace, but these two horses weren’t that far apart. The video and the Pace Figures bear that out.
It turns out the factor that most affected the difference between Wise Dan and Optimizer is the extra weight carried by the former. Since this race was a “Handicap” race, and Wise Dan was deemed to be a more accomplished horse (he is the 2-time Horse of the Year), he was assigned a weight of 127 pounds. Optimizer on the other hand carried only 116 pounds.
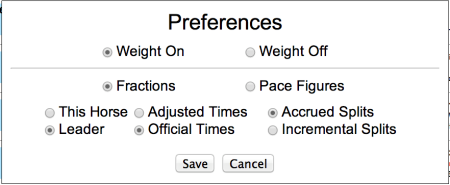
The “default” speed figures calculated by TimeformUS incorporates the weight carried by horses. However, you can choose to not have weight included in the calculation if you are of the mindset that weight shouldn’t make that much of a difference. Click here to read an article on the TimeformUS website that explains this option. The way you make this choice is by clicking on the running lines and a “Preferences” pop-up window like the one below provides you with the option for “Weight On” or “Weight Off.”
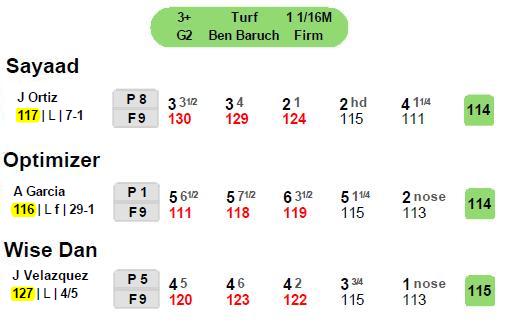
After changing the preference to “Weight Off,” you can see below the resulting Speed Figures change markedly. We highlighted the weight as a reminder that it is no longer being included in the calculation.
With weights out of the mix, the difference between Optimizer and Wise Dan is merely 1-point, which is a result of the latter being marginally closer to the fast pace.
The choice to factor in weights is one of personal preference, and having realized this, TimeformUS provides you with the option. Just keep in mind that “Weight On” is the default setting.
Getting back to the difference between TimeformUS Speed Figures and Beyer Speed Figures, the latter does not incorporate the Pace or Weight into their calculation. A horse that finishes a length ahead of another horse, will always have a higher Beyer Figure. In this example, Optimizer had a Beyer Fig of [104] and Sayaad was [101], reflecting the difference of finishing 2nd and 4th separated by a little more than a length. And, two horses that finish a nose apart will have the same Beyer Speed Figure regardless of the pace scenario or weight carried. So, in this example, Wise Dan earned a Beyer Figure of [104], identical to Optimizer.
The purpose of this article is not to judge whether TimeformUS Speed Figures are better or worse than Beyer Speed Figures. (Click here to review an article explaining Beyer Speed Figures) Ultimately, the measure of any figure is tied to the algorithms and individuals calculating the figures. With that said, in the short time I’ve been using both figures, I’ve found several solid priced winners that were revealed by a difference between the two figures. In a future article we will present some real world examples and attempt to offer some opinions based upon our experiences.
Click here to learn more about TimeformUS Speed Figures on the TimeformUS website., including a short video that gives a nice overview of what we covered in this article. Also, TimeformUS provides two free races each day on their website. It’s a great opportunity to test drive their program at no cost.


9 comments on “TimeformUS Speed Figures – Explained and Contrasted to Beyer Figs”