Know Your Trainers – Peter Miller vs. John Sadler
A frequent question asked by new fans trying to learn more about horse racing is, “Where do I begin?” My immediate response is generally, “Get to know your trainers.” While learning about topics like distance, class, and pace are important … in my opinion, none are as important as learning about the tendencies, strengths, and weaknesses of trainers. With that thought in mind, we continue our series of articles called “Know Your Trainers.”
In this series we will dig into the statistics of some head trainers and try to make sense of the numbers we find. We thought it might be fun to present the numbers in a “competitive” manner by pairing trainers. With that said, we are not trying to judge the trainers or claim that one is better than another. Our intention is to pair trainers who have statistics in comparable categories and present some plausible reasons why they might differ.
The two trainers in this article, Peter Miller and John Sadler, both work on the Southern California racing circuit.
Before we start, here is an explanation of each column in the charts below:
- STR = Number of starts
- 1st = Number of wins.
- 2nd = Number of place finishes.
- 3rd = Number of show finishes.
- WIN% = Overall percentage of wins based on number of starts.
- EXA%= Percentage of times the horse finished in an exacta position (either 1st or 2nd).
- ITM% = Percentage of times the horse finished In-The-Money (1st, 2nd, or 3rd).
- ROI = Return on Investment, based on a $2 flat Win bet for every starter. Over $2 is profitable. For example, if there were 100 starters, and the ROI was $3 … The total wagered would equal $200 ($2 x 100). The return would be $300 ($3 x 100). If the ROI were $0.50, then the return would be $50 (50-cents x 100) … resulting in a loss of $150.
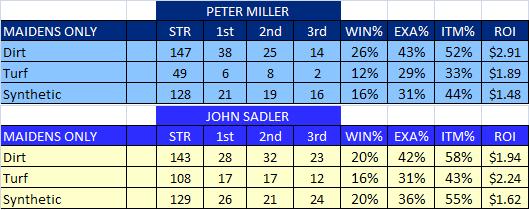
Let’s begin by looking at our two trainers in an area where they have plenty of starters over the past two years, horses running in Maiden Races. We separate their results by surface below.

Peter Miller clearly has had the most success with his maidens over a dirt surface. His Win rate of 26% and ROI of $2.91 is superb and tops both trainers on all surfaces. Also interesting is that both Miller (43%) and Sadler (42%) have managed to get more than 40% of their maidens (on dirt) into the exacta – something horseplayers should consider when constructing their exotic intra-race tickets.
Miller’s win percentage drops off significantly for his maidens on turf and synthetic surfaces. And his ROI of only $1.48 on a synthetic surface suggests that maybe the bettors have been overplaying him due to his recent success at Del Mar, where Miller has led all trainers in total wins the past three meets. Del Mar was a synthetic surface during that time period.
With Del Mar changing back to a dirt surface in 2015, it will be interesting to see what happens to Miller’s statistics next year. Will bettors overplay Miller due to his recent success at Del Mar? Or will the uncertainty of the new surface create opportunities to catch his dirt maidens at a fair price? His established success on dirt should give horseplayers enough confidence to back him right out of the gate, hopefully getting some value early on in the meet.
Sadler is fairly consistent on all three surfaces with his maidens when it comes to his percentages. His ROI is best on the turf and lowest on the synthetic, despite winning more races there. With that said, we did uncover one very interesting bit of information when digging a little further into his results. Out of his 70 horses that finished 2nd in maiden races, 34 of them lost by 1-length or less. That’s means 50% of his Place horses were serious threats to win and with a little better racing luck his Win% and ROI could have been much higher.
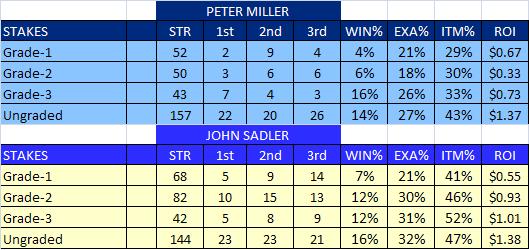
Next we’ll look at how our trainer’s horses have performed at the highest class levels in the sport, Stakes races. We separated the results by levels of Graded Stakes and then all Ungraded Stakes races. In order to get a comparable number of starts we went back 5 years for Peter Miller and 3 years for John Sadler.
The results for Peter Miller suggest that he does not have much G1/G2 talent in his barn at the present time, winning only 5 out of 102 starts. This low Win% translates to an equally low ROI of course. And despite his relatively better Win% in G3 and Ungraded Stakes, his ROI remains quite low for both categories. These ROI amounts suggest that Miller is well backed at the windows, but the results don’t match the optimism bettors have had in his Stakes horses. At least not up to this point.
John Sadler’s Win% for Graded Stakes races is between 7% and 12%. His results in Ungraded Stakes is a little better, winning 16%. But, when all is said and done, his low win rate and ROI between $0.55 and $1.38 make it hard to recommend him for many Win or Multi-race wagers when involved in Stakes races. More encouraging is his decent ITM rate (41%-52%) for all levels of stakes races and suggests that horseplayers should include his horses in underneath positions for exotic intra-race wagers.
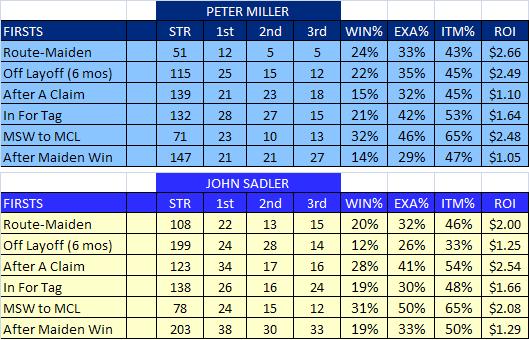
Now we’re going to look at series of “Firsts” for our two trainers. How do their horses perform when they are:
- Trying a route (1-mile or more) distance for the first time. We limited this to maidens only.
- Making their first race attempt after a layoff of more than six months.
- Starting for our trainer the first time after being claimed from another trainer.
- Dropped in for a claiming tag for the first time in their career, excluding Maiden Claiming races.
- Entered in a Maiden Claiming race for the first time after starting in Maiden Special Weight races.
- Moving up to another class for the first time after “breaking their maiden.”
- Both trainers do quite well when their maidens make their first route attempt. Interesting that their three percentages are nearly identical. Miller has the better ROI of $2.66.
- In the category of layoffs, Miller has the clear edge in every category, suggesting that his horses are more “well meant” than Sadler’s charges when making their return to the racetrack after a long break.
- When it comes to the claiming game, it appears Sadler might have the better eye for identifying horses to claim. His Win rate of 28% “after a claim” is exceptional and his ROI of $2.54 is tops for his “first” categories.
- There is very little separating Miller and Sadler when they decide to drop their horses “In For A Tag” for the first time. Their percentages and ROI are nearly identical. Despite having respectable Win rates around 20%, their ROI around $1.65 suggests they’re not optimal bets for the horseplayer.
- Their results when dropping from Maiden Special Weight to Maiden Claiming are also quite similar, and substantially better than the prior category. Winning at more than 30% and hitting the board 65% of the time suggest these type of horses are very “live” for these trainers, and positive ROI numbers make them worth backing.
- In the last category, the good news is Miller and Sadler win a lot of maiden races, setting up these “after maiden win” races. The bad news for horseplayers is they appear to be often overplayed in their next start. With an ROI of slightly more than $1 each, it might be better to avoid these horses in the Win pool.
The final category we’re going to consider is how Miller and Sadler do in Marathon races. We define marathons as a race 10 furlongs (11/4 mile) or more.
While there are a limited number of starters on dirt, with a combined record of 17-001, it’s hard to recommend either trainer in a marathon race on dirt.
When it comes to turf marathons, we have a clear contrast in results. Miller has relatively low percentages across the board, and a low ROI ($0.54) as a result. Sadler on the other hand has strong percentages in all three categories, and should be given serious consideration for both intra-race and multi-race wagers in these long distance races.


One comment on “Know Your Trainers – Peter Miller vs. John Sadler”